

Matt@pcmtec
-
Posts
56 -
Joined
-
Last visited
-
Days Won
11
Content Type
Profiles
Forums
Events
Posts posted by Matt@pcmtec
-
-
Quote
seeing 5.03 meter vs 4.93 on the logger
Is this measured at the DLP terminals. As puffwagon has stated, there can be voltage drop if measuring from a different ground point.
With regards to drivers, FTDI are the developers for these on the DLP boards:
https://ftdichip.com/drivers/vcp-drivers/
Hjtrbo, Looks great! You had to do the same thing as myself (adding to Nistune software) and put the lambda/AFR checkbox in there so you pickup the data from the AEM correctly. They also do a 'boost' gauge with similar output
-
Current fields are:
ID (generic ID, or layout ID)
Order (0-15 in charts, above this hidden)
Min range
Max range
Custom Display name,
Message priority level
Scalar list position (order display on the LHS panel)
Group list position (reserved for future use, group display on LHS panel)
Layout ID
Custom Logging name
ID can be for example a generic ID such as EOT, ECT, ENGINE_SPEED etc or a MIDxxxxx. The idea here is that when using a layout between different vehicles which may have a different MID for common parameters is that those parameters don't get lost
In the next upcoming release, when a layout is loaded, those IDs which are not in a channel list for a vehicle (say you have some IDs for Falcon but not displayed in Mustang) then those will be kept in the saved layout sessions (currently the layouts only save things in the channel list)
We are looking to move the layout TLO to an XML format in the future, particularly if there are additional parameters getting added in. The number of entries has expanded a fair bit since the 1.25 version which was just ID, order and ranges!
-
 1
1
-
-
-
Possible alternative for DIY enthusiasts with Arduino device (such as the Nano or Mini). The project I've pasted here
https://forum.nistune.com/viewtopic.php?f=32&t=3880
Load the Arudino IDE, create a new project, paste code, compile and upload to the Nano/Mini
Connect all unused inputs to ground, then it works same as the DLP
-
2
-
-
On 9/1/2021 at 5:28 PM, Bill said:
Hi Matt, having a play with histograms this afternoon & didn't have a suitable log file created with 2.10 to use the trace function so I've opened a couple of 1.25 logs. I've found it appears to update the file & it increases in file size. After this happens, it's no longer able to be opened in 1.25. It also distorts some of the values eg temps. If a workshop were to need to review a previous log created in 1.25 to confirm/prove what was logged whilst tuning, their log would be lost or invalid due to values displayed.
Some examples where the temps are skewed when a 1.25 file is opened in 2.10. Changing units only makes the extreme temps even more extreme.
Hi Bill. Thanks for the report. We have now fixed these issues with the latest beta version. With 1.25 files these are now upgraded to a backups folder and loaded from there (so you can still use the original file with 1.25 later on). Also we fixed up an issue with unit conversion which affected the temperatures when displaying in the 2.10 beta
-
 1
1
-
-
Changes to data logging:

- Log and channels tabs are now in the top section
- Bottom section displays RPM (when available), and can be zoomed in

- Selected parameter highlighted in log

- Playback / Live channels displayed, depending if a log file is opened or connected to the PCM

- Details tickbox will display sidebars with displayed values and units

CTRL will select start and end of Average / Trace selection

TRACE button displays histograms and maptracing

If over 5 minutes of logging is selected, then the trace lines will not be available, and Trace button becomes red

Trace window selection:

Histogram, select scales and histo trace values:

(Or load them from a table)

Press OK to display the histogram:

Trace cursor updates and the trace line can be disabled if required. Decimal points can be adjusted
Map Trace tables can be searched, and clicked on for one click trace display:


Use CTRL UP/DOWN to adjust label positions

Right click to access options such as adjusting priority (update rate) of parameters

Or colours, range and chart positioning

Layout load, save and appending is now located as a popup in the bottom panel of the log window

-
1
-
-
Quote
I reloaded a log and F2 is doing nothing again
Pressing F2 (and then click the parameter) during log playback will not change the names. Just tested 1.25 and looks like rename list items is only available in 2.00 when connected to the DLP in 'live' mode.
-
1
-
-
Make sure to connect all unused inputs (2-8) to the black (ground) line to prevent 'flapping' neighbour signals affecting your main signal on pin 1

-
DLP devices use the FTDI drivers which come with Windows drivers by default these days. You can check the device inside Device Manager > Ports

-
Press F2 to enter edit mode, and then click on the name and you should get your cursor to change the name
-
1
-
-
We will add lambda units (percentage %) to LTFT for next release. Histograms will allow you to apply values as a percentage of the existing map. I can't give a release date due to the large of amount of updates going into it, but can say that the histogram work is ready for internal testing
-
Firstly read the file from your PCM. This will get the current OS and maps, plus VIN and model details.
Use the the Read/Write vehicle icon to open the Flash Toolbox


Save afterwards say as HACCKD5_readPCM.tec

If the vehicle is not licenced, then use Licence Vehicle to licence the file. Then start the Custom OS wizard
Custom OS Wizard

This starts the wizard. If you have a previous custom OS in the vehicle you will need to press previous 3x to return to the main screen and start over.

If you have a Mk1 FG you will need to upgrade to the HAEE Operating System. Please see this guide for more details
Click Next
Dual Tune Flex Sensor
For a Dual Tune using the Flex Sensor, select 'Via Flex Sensor'

Select the flex kit you are using

This can be configured later
If you are using a Pirotta plug and play kit select the kit you have purchased (Zeitronix or Innovate), you can modify this calibration later by editing the Pirotta Performance Flex kit table curve. This can be accessed via the navigator tree after the Custom OS has been created

If you are using a custom flex fuel converter kit use the Voltage Conversion table for sensor/switch table. This can also be used with an on/off switch to toggle between E85 and 98.

You now have the option to increase the table sizes inside Custom OS, typically this would be left stock. For this example we will use stock spark and speed density table sizes

Next you can add extra tables to the base tables for ethanol flex blending

For example if we adding auF2433 to adjust the MBT spark by coolant temperature, we can tick and then add to Blend Ramp for Spark by pressing the -> button next to the Spark Blend Ramp. If you make a mistake and need to remove a table you can press the <- arrow to remove it. You can also use Ctrl + A or Shift + Click to select then press the space bar to select.

For E85 cold start it is recommended to add the following tables to the fuel blend ramp.

Any scalars selected like LTFT will be used later by the Flex Fuel Multi Tune Ethanol switch point. It doesn't matter which blend category you add them to as they will not be interpolated. These scalars will instead be selected when the ethanol content is above the value in the "Flex Fuel Multi Tune Ethanol switch point" scalar. By default this is set to E42.5

Once you have added any extra tables on top of the default tables, press 'Check licence and Proceed'. Full credit pricing is detailed on the start page of the custom OS wizard. When you have finished creating the custom OS you can add up the total credits spent via help -> view licenses and summing the credits for the vehicles VIN.

Then provide a new file name to save as. For example: HACCKD5_readPCM_Stock_CustomOS.tec
For this example we will use default options (using the Pirotta Performance Flex fuel kit)

Final confirmation

After the configuration window is finished, you can later enable various custom operating system features in the Custom Operating System configuration list. You can also edit these by revisiting the custom operating system wizard which you can run as many times as you'd like.

Each section (Fuel, Spark, Boost etc) has a blend ramp between 0% Ethanol (98 octane) and 85% Ethanol (E85)
An example of the below:Note: You need to experimentally determine these blend ramps
These ramps must be determined on a dyno with knock monitoring equipment. It is not safe to assume these values. Typically you would not want to start adding timing until you see at least E20, you will also find some engines can take full timing by ~E70.

To see the tables that the blend ramp affects, scroll further down in the view:

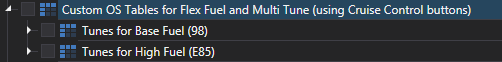
The actual tables fuel fuel, spark, VCT, boost etc you can modify are located under Custom OS Table for Flex Fuel and Multi Tune

Next start your tune 98 octane, and work with the first set of tables listed under "Tune 1 Base Tune or 98", afterwards drain the tank, fill with E85 and work with the second set of tables under "Tune 1 Base Tune for E85". If you have enabled a multi tune, be sure that you have selected tune 1 via the cruise control buttons until the base tune is completed.

Other tables
Ethanol Conversion to Stoich
Used for closed loop operation to adjust the stoichometric ratio depending on the level of E85. This would not typically be adjusted, the only time it would be recommended to use non standard values is when you are utilising an existing E85 tune that used a different stoichiometric value.

Scalars switch point
This scalar specifies the ethanol percentage when switching over from 98 octane operation to E85 operation for scalars
These will be switched between 98 and E85 based on the below configurable switch point:These will be switched between 98 and E85 based on the below configurable switch point:

Multi Tune with Flex
A multi tune with flex fuel allows you to build two sets of 4 tunes. One for 98 and one for E85, eg a typical setup would be low boost/high boost/boost by gear. Then the flex fuel sensor will interpolate between the two sets of 4 tunes depending on ethanol content.
This is setup similar to the above flex fuel setup, with the following changes:In the wizard, select Multi Tune:

Then select Flex fuel sensor from the drop down

Then the kits lookup table you are using

Continue selecting if you want expanded maps (or not)
Then select the tables you wish to use for Flex and proceed with adding to Custom OS

After you have finished, you can view which multi tune maps are used for each blending table by clicking on the blended ramp parameter and then viewing the tables they are blended from and to:

Logging Ethanol
Add the 'PM' (Normalised value of percentage of alcohol) to the logging list to view ethanol content in the logs

if the PM (Ethanol Content) does not match the ethanol content on the gauge or tank you will need to recalibrate the analog input. To do this fill the tank in 10 steps from E0 to E85 making note of the real ethanol content and the sensor voltage. Once complete you can update the voltage table (either the pirotta or custom voltage input depending on which option was selected earlier).
Depending on which vehicle you can log the analog input via the following items.BF/FG/FGX I6
Ego Voltage B1S2 (bank 1 sensor 2) : EGO RAW B1DID: MID80545 (VEGO[0][1])
BF/FG/FGX V8
Ego Voltage B2S2 (bank 2 sensor 2) : EGO RAW B2DID: MID80547 (VEGO[1][1])
Note: if you used the opposite rear o2 sensor, then B1S2 (EGO RAW B1D)
FLEX ALC% to monitor Flex percentage (can view as absolute or % values)
ID: MID69386
BA I6
IAP_VOLTS (boost sensor voltage)


-
13 hours ago, finnigan001 said:
What i was talking about is if you've done a log but only saved it as a .teclog closed pcmtec than reopened pcmtec. If you then open the teclog and try to save as a csv then it won't save all the data in the csv. It's not to do with the poll rate. Matt has previously said that its not supported. Happens sometimes when out logging and save and i forget to switch to csv before saving. Just means i can't do anything outside of pcmtec which can be frustrating when making the simple mistake.
Previously save CSV from TEC was not supported (disabled) but I've since added this back in, but not really compared CSV files saved direct from a live session vs re-saved from a TECLOG
Save CSV/TEC will save per each 50ms whatever the values were in the chart at that time (even if there were no message updates). Rawcsv only displays messages updated at that time
If possible, can you post here one of your saved TECLOG files, which you then also saved the CSV from? And the TLO (layout file) you were using? I'll try and re-create here and see what I can do to improve it
-
We are looking into adding some of the Workshop parameters to Pro version, so will update once that has been done (in 1.23 release coming up)
-
1
-
-
UPDATE: 12-09-22

Introduction
The data logger is build into the PCMTEC editor, and allows you to seamlessly log your vehicle, and switch between the Nagivator and Flashing windows during a logging session, and then continue logging after reflashing and restarting the vehicle.
2.11 October 2022 Update
Once the Datalogger windows is opened, and the vehicle ignition turned on, the data logger will automatically connect to the Vehicle PCM:

Vehicles with a ZF automatic transmission can connect also the the transmission, using the 'Trans' button
External logging for recording AFRs, boost pressure or other user defined variables can be done using the DLP IO8-G Analogue/Digitial converter. This is covered in another HOWTO here
Selecting Channels
Use the Channels tab to select which Scalars you wish to view in the chart. Whilst the chart itself can display upto 16 channels (comrised of 4 charts, with 4 slots per chart), extra channels can be logged and saved and reviewed later on.
These can be selected live whilst connected to the PCM and TCM (ZF) and are then added to the logging session.

Clicking on the Scalars tab displays the currently selected items. Anything greyed out is not displayed on the chart, but can be added using the right click menu

Allocating Chart Items
Right click and select a Chart item to allocated TQ_ETC_SRC to Chart 4 / Slot 1 for example
Otherwise use Multi Chart add to quickly add to the next available slot (if any are available)

That now displays in our chart

Using Scalar Delete will remove items from the chart, but they will still be recorded as part of the logging session
Using Chart Remove will free up the slot on the chart, but keep logging it and displayed in the Scalar section (greyed out)
Adjusting Ranges
There are several methods to adjust ranges of scalars from their defaults:
1. Right click Scalar and adjust range

2. Click and use the Zoom +/- buttons

3. Hover the axis and use the mouse scroll button, and adjust by hold and move up / down

4. Otherwise click the axis and use CTRL PAGE / CTRL DOWN keys
Use the PAGE UP / PAGE DOWN keys to adjust the position of the axis
5. Right click the axis and adjust the range using the window

All range adjustments are saved, and can be stored in the save Layout feature
Sorting Scalar items list
By default all items are sorted into their 'parent' groups, matching the Channel tree. If you Right click and disable 'auto sort' you can custom configure the ordering of the 'Scalars list'


Here I used CTRL UP and CTRL DOWN to move the scalar items with all temperature scalars positioned together
Enumerated Items
Some chart items like FUEL_SOURCE and TQ_ETC_SRC have meanings attached to the values, these are enumerated items. You can display the raw value by unticking the Enumerated tickbox

Update rates
Whilst there are no limitations on the number of channels you can log, on BA all channels will be 'polled'. Adding more channels will gradually reduce the update rate. On vehicles BF upwards, rapid packet reading is available for upto at least 15 DMRs and then polling available on top of this.
If one of the channels you have selected requires a faster update rate, it can be forced to use rapid packet by selecting High Priority for that channel

The priority tickbox (left of the Scalar name) will be enabled for those High priority items you have selected. If none are selected then at least the 15 first DMRs in the list will be used for rapid packet.
Layout Load / Save
Use the Save / Load / Load append layout buttons (also available from the File menu) to keep a copy of your current chart configuration, including the items ticked, their chart slot and their ranges

Load append will add extra chart items to your current chart (ticked and their position if available) if they were not ticked previously. Note: Where a slot is already used, these will be ignored and not displayed
Layout files are saved in the PCMTec/Logging layouts folder, and saved as TLO files

Pause / Start / Clear buttons

During logging you can pause the live log updates (logging will still happen in the background) and then review your current log by moving the blue cursor

You can drag the cursor with the LHS mouse button and moving the mouse, or using the LEFT / RIGHT cursor keys. Holding the cursor keys will flip through the log page by page as it scrolls through the log. The legend/scalar values will update showing the current values at the cursor, even during a live logging session.
Clear button will clear out the current log. If the logging is over 10 seconds then you will be prompted if you want to keep the log. Logs are auto saved in case you wish to retrieve something later, then check out the auto save folder

Loading and Saving Logs

Use the Save icon to save your log as a TECLOG or CSV file (for loading into other software like MegaLogViewer for example)
Open the file will start in the PCMTec/Data logs folder, where your save files are located

CSV files from PCMTEC as well as other Ford tuning software export CSV format, are supported by the data logger for playback mode

In playback mode, you can press Start to begin playback, and pause to stop.
Display Options

Smoothing: is on by default and will remove some of "stair casing" of the chart data


Auto range: is off by default. This will adjust the chart range based on what has been logged so far (or the range during playback).

Turning on will adjust the range to fit the current screen you see:

Auto scroll: will stop the chart scrolling if unticked
Legend: when unticked will hide the legend window if required

Adjusting units
Units must be adjusted whilst the PCM is disconnected. When doing this, the charts will be auto scaled to the new units type (for example from deg F to deg C)
Either adjust individually, from the Units dropdown:

Or adjust everything from bulk change:

Zooming
The time axis can be zoomed in and out using the scroll wheel on the mouse, when hovered over the main chart. Either zoom to the Left or Right hand side of the chart, upto a maximum of 1/8 second zoom level.
Using the keyboard, using UP and DOWN arrow keys will also perform similar zoom functions
Full short cut keys are available with F1 or the Shortcuts icon

Full short cut keys descriptions are in this HOWTO
-
2
-
-
On 3/26/2020 at 6:10 PM, Superb said:
Are these options available if I upgrade to Pro?
Just checked through these today and at this time Pro and Enthusiast have the same list of DMRs. Only Workshop contains the extra parameters
-
1
-
-
Data Logger:

DLP A/D converter
More info https://www.dlpdesign.com/usb/io8.shtml and purchase here https://au.mouser.com/_/?Keyword=DLP-IO8-G
Top section
Vehicle: Connect/disconnect the PCM
Trans: Connect/disconnect the ZF Transmission
DLP: Connect/disconnect the DLP-IO8-G converter
Start/Pause: Start / Pause live logging or playback. During pause mode you can scroll through the log whilst still recording live data
Clear: Clear the current log file
Smoothing: For decimal Scalar items will interpolate between read-in values to smooth the output file.
Auto range: When enable will automatically scale Scalar to what is on the screen, rather than the user log range, or the range of what has been received during logging
Auto scroll: Keep scrolling during live logging
Legend: Hides the transparent legend box if disabled
Logger section
Up (or Mouse wheel up) : will zoom in on the time axis (or the Scalar axis if hovered over)
Down (or Mouse wheel down) : will zoom out on the time axis (or the Scalar axis if hovered over)
Left / Right : will move the blue cursor through the log. Hold down to speed step through the log
Page Up / Page Down: Click on the Scalar axis to select which one you want to move, then these keys will shift it up / down
Ctrl + Page Up : will zoom in on the selected Scalar axis
Ctrl + Page Down : will zoom out on the selected Scalar axis
Right click scalar: Adjust the min/max range of the Scalar
Scalar section
Keys:
Up / Down: will move through the scalar list
Ctrl + Up: will move the current Scalar item up the list (if sorting off)
Ctrl + Down: will move the current Scalar item down the list (if sorting off)
Del: will remove the current scalar from the logger
Buttons:
+ / - Decimals: Increases / decreases the number of decimal places for the selected Scalar
X Remove: Performs a scalar delete, removing the item from logging Scalar list and log display
+ / - Zoom: Zooms in /out the range the selected Scalar
Show ID: Switch between full name and ID of the Scalar
Shortcuts / F1: Display these keyboard shortcuts
Save / Load / Load Append Layout: Save and load the current chart layout. Also loads/saves user set unit ranges.
*Append will add any extra chart items not in the current scalar list
Right Click Menu
Displays context menu with the following options:
Chart 1-4: Move the current Scalar to the selected chart
Multi chart add: If you have multiple Scalars selected, automatically assign them a chart slot (if availalble)
Chart remove: Removes the item from the log display, but keeps logging it in the Scalar list
Scalar delete: Removes the item from logging Scalar list and log display
Auto sort: Sorts items into groups. Otherwise if off, then user can sort items and save/load these layouts
Adjust range: Adjust the min/max range of the Scalar
High priority: Increases the read rate of the selected scalar. Normally the first 15 high priority scalars are at a higher rate, depending on PCM model
Enumerated: Switch between word display of item (such as Torque Source) and the raw number value
Equation: Edit the equation for the Scalar (only for DLP which converts raw volts into custom units)
-
1
-
-
Hi Steve
When you first opened the data logger, it loaded the last opened/saved file and it had the "Save Log layout" menu available at this time. Saving layouts should only be shown when connected to the vehicle, so this has been rectified for the next release
-
Quote
As in is there a way to lock the scaling in so that everything you log, you do not have to move/ scale each PID
This has now been added in today for the next release
QuoteAlso can you change the order listing of the pids
The PIDs will now all be listed in groups on the left hand panel. The charts on the right hand side can be now be manually grouped
QuoteCan you have all the logging expand to full size height based on min/ max values etc.
Next release you will be able to adjust the min/max height for each graph using the scroll on the Y Axis
-
On 8/24/2019 at 12:47 PM, finnigan001 said:
Only happens when i open a previously saved teclog and the save as a csv.
This functionality is not supported, so you cannot save after loading a TECLOG file. The save button has been now disabled in playback mode
edit: This is now fixed and will be in the next beta.


HOWTO: 8 Channel Analog Input Datalogging
in General HOWTO Guides
Posted
Updated images on this thread to match that of the Datalogger Manual
If you have not seen this yet, it is available under help